This lab session demonstrates the visualization of historic simulation data via the web-based Grafana dashboard. For this purpose, VILLASnode persists the simulation data into the InfluxDB time-series database via a dedicated InfluxDB node-type.
This node-type streams the simulation data via UDP to an InfluxDB database using the line protocol.
Further information
Prerequisites
Up-to-date versions of:
- VILLASnode
- Docker
- docker-compose
1. Prepare Grafana and InfluxDB
We first need to prepare a standard Grafana and InfluxDB setup. For this task we use Docker containers and the following docker-compose.yml file.
docker-compose.yml
influxdb:
image: influxdb:1.7.10
container_name: influxdb
ports:
- "8083:8083"
- "8086:8086"
- "8090:8090"
- "8089:8089/udp"
environment:
- INFLUXDB_DATA_ENGINE=tsm1
- INFLUXDB_REPORTING_DISABLED=false
- INFLUXDB_DB=villas
- INFLUXDB_ADMIN_USER=admin
- INFLUXDB_ADMIN_PASSWORD=admin
- INFLUXDB_UDP_ENABLED=true
- INFLUXDB_UDP_DATABASE=villas
grafana:
image: grafana/grafana:6.6.2
container_name: grafana
ports:
- "3000:3000"
environment:
- GF_SECURITY_ADMIN_USER=admin
- GF_SECURITY_ADMIN_PASSWORD=admin
links:
- influxdb
Steps
- Copy the contents of the
docker-compose.yml file to a new file on your system.
- Bring-up Grafana and InfluxDB with:
docker-compose up -d from the same directory
- Open the Grafana web-interface at: http://localhost:3000/
- Login with the credentials:
- Follow the setup wizard of Grafana and add a new data source with the following parameters
2. Import Demo Dashboard into Grafana
Add a new dashboard to Grafana by importing the following file: VILLAS test dashboard
3. Run dummy simulation to fill InfluxDB with test data
villas.conf
nodes = {
influx = {
type = "influxdb",
server = "influxdb:8089",
key = "villas"
# Send updates in batches of 50 samples
in = {
vectorize = 50
}
}
siggen = {
type = "signal",
signal = "mixed",
values = 6
rate = 50.0
}
}
paths = (
{
in = "siggen"
out = "influx"
}
)
Steps
- Add the following lines to a new file name
villas.conf.
- Run to following command to generate test data which VILLAsnode will store in the InfluxDB database:
villas-node villas.conf
- Return to Grafana to inspect the data
Screenshot
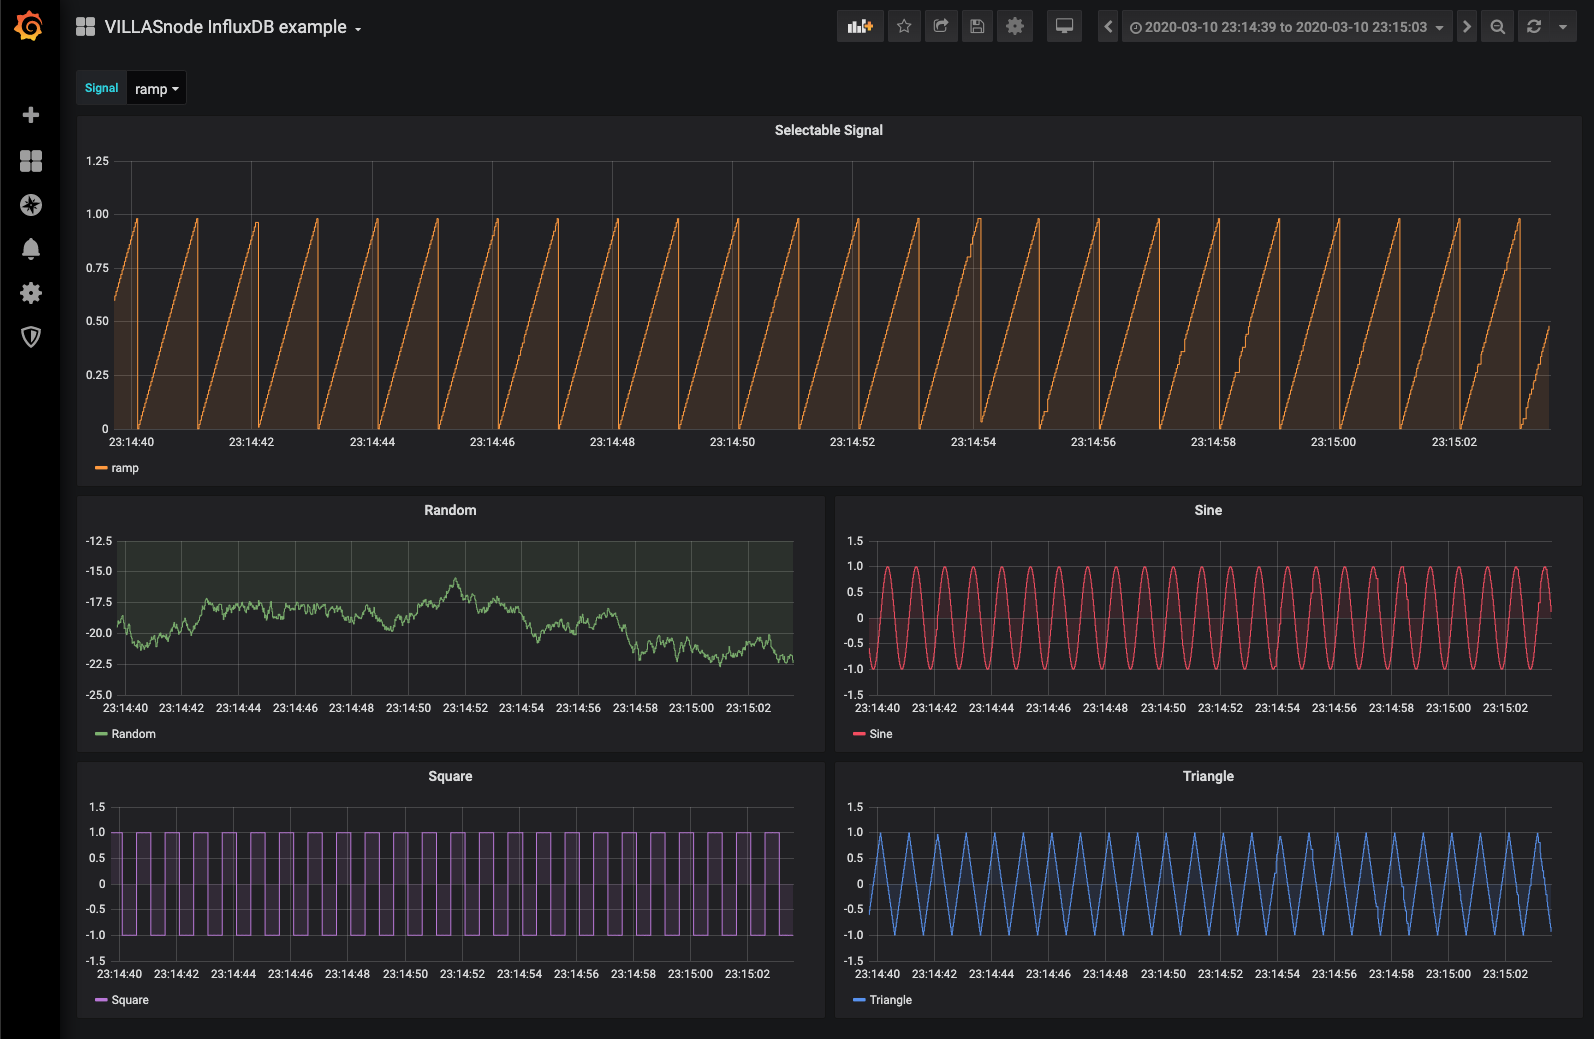
Grafana Dashboard
Go to [lab 17] =>(node-lab-17)
